
A complete map of the cerebral connections, the connectome, is required for interpreting measurements of the signals transmitted between neurons. In the human brain, these signals travel in a complex network of 100 billion or so neurons, each of which is connected to 10,000 others, through the axons which constitute the bundles of white matter fibers.
Identifying these pathways of connections is a first approach to establish such a map. Another approach, known as functional connectivity, is to follow the spontaneous activity synchronized between the groups of neurons.
The combination of these two approaches is possible thanks to the advances of both anatomical and functional Magnetic Resonance Imaging (MRI) technologies. Our project deals with this new framework of the modern neuroscience, the connectomics, which examines the anatomical organization and the functioning of the brain through the connectome to relate it with the cognitive functioning.
- Structural connecivity: L. Petit (contact)
- Intrinsic connectivity : M. Joliot (contact), Ginesis Lab
Describing the structure of the human connectome…
First, the connectome is principally about structure, about the extensive but finite set of physical links between the neurons, namely the axons. The physical reality of structural connectivity is presently accessible with diffusion-weighted magnetic resonance imaging (dMRI) and high-resolution tractography.
Diffusion MRI reflects the random diffusion of water molecules, which is affected by the microscopic structure of tissue, here the human brain, enabling us to infer the microarchitecture of these tissues en term of local density and structural organization. The diffusion signal of the water molecules within a very compact and well-arranged white matter structure in only one direction as the corpus callosum is very different from that measured in the gray matter where the water diffuses more freely.
In addition, axon bundles in white matter create orientation dependence of water movement as a result of hindrance of diffusion perpendicular to the long axis of white matter tracts, an effect that can be tracked from voxel to voxel to derive long-range white matter pathways and which is called tractography. Diffusion weighted tractography is thus the only non-invasive tool available to obtain information about neural architecture of human brain white matter.
It is therefore possible to represent in vivo the tridimensional network of anatomical connections between the different regions of the brain in the form of virtual fibers, each representing several thousand or even tens of thousands of axons. This highly intertwined but highly organized network, called a tractogram, consists of bundles of white matter fibers as defined by neuroanatomists by post-mortem dissection since the 19th century. But like them, a specific methodology must be put in place in order to extract these different bundles and to better understand this structural connectivity.
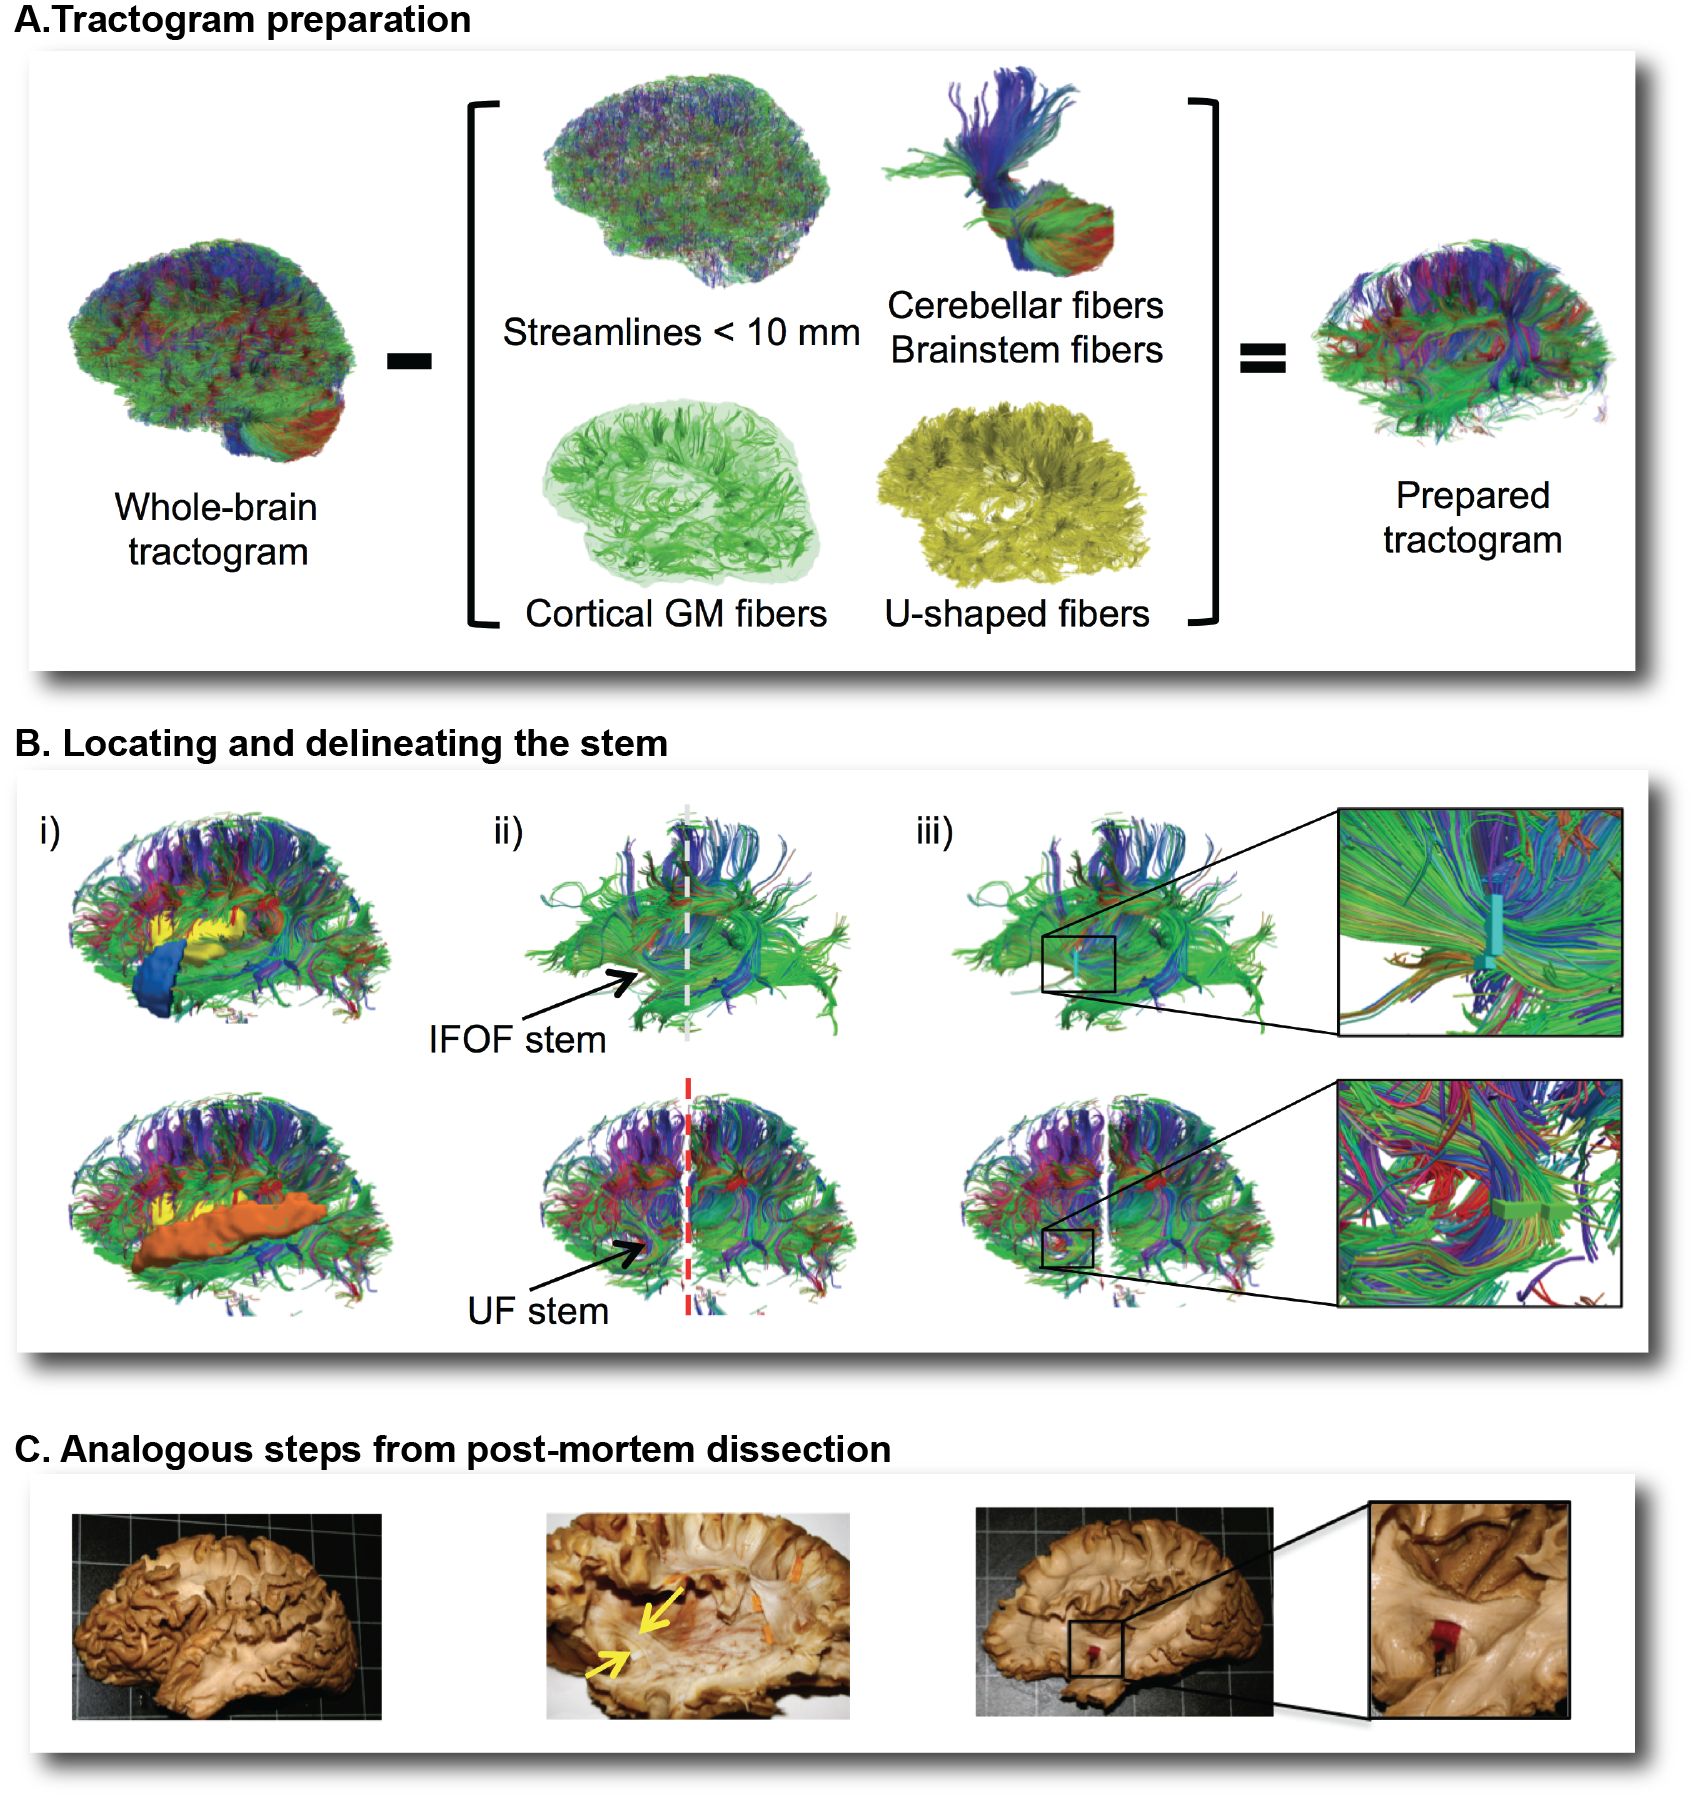
Box 1. Overview of the virtual dissection of the inferior fronto-occipital (IFOF) and uncinate (UF) fasciculi with the stem-based method.
In the first step, we removed from the whole-brain tractogram (A): the extraneous streamlines shorter than 10 mm, the superficial streamlines restricted to the cortical gray matter and the U-shaped streamlines passing through the superficial white matter. We also removed the streamlines passing through the cerebellum and the brainstem as well as the callosal streamlines passing through the inter-hemispheric fissure as they do not belong to the association pathways. In the next step, the removal of the U-shaped streamlines with terminations within the insula and the temporal pole exposed the IFOF stem (B, top), while the removal of the streamlines terminating within the insula and the superior temporal gyrus exposed the UF stem (B, bottom). Once the stem was exposed, a ROI was manually drawn that strictly encompassed it in the same manner a paper tag is inserted under a narrow stem during post-mortem dissection (C).
To answer this, we combine approaches derived from post-mortem dissection and automatic extraction methods to identify all the pathways of white matter fiber connections on large cohorts of subjects such as BIL&GIN and MRi-Share.
We have thus developed a method of virtual dissection of the white matter bundles, reproducing as closely as possible the gestures of the neuroanatomist when he/she dissects these same post-mortem bundles (Hau et al., 2016a, b). The goal is to identify the stem, tha is the convergence zone where all the fibers of a same bundle pass. Applied to the study of the inferior fronto-occipital (IFOF) and uncinate (UF) fascicles (Box 1), and validated by post-mortem dissection in collaboration with S. Sarubbo (SFC-Lab, Trento, Italy), this method allowed to describe the map of the cortical terminations of these bundles with a much better precision than what is usually documented. The quality of the tractograms on which we perform these virtual dissections is also primordial. In this regard, we are benefiting from the cutting-edge tools thanks to our collaboration with the Sherbrooke Imaging Connectivity Lab (SCIL) led by Prof. M. Descoteaux, internationally recognized for their work on tracography.
…in relation with the cognitive functioning.
While the diffusion MRI and the tractography reveal the structural organization of the brain, the functional organization is the object of the study of the intrinsic connectivity. Still using MRI, it is possible to record the variations in the concentration of deoxyhemoglobin contained in the blood. This is called functional MRI (fMRI) or BOLD (“Blood oxygen level dependent”). BOLD variations occur mostly in the gray matter, namely in the cortical regions and the gray nuclei, starting points or arriving white matter fibers. These variations are well known since the advent of haemodynamic imaging in the 1980s, and are the marker of the functioning of networks of cerebral regions supporting cognition. They directly index (using positron emission tomography, PET) or indirectly (using fMRI) the increase in cerebral blood flow following the activation of a given region.
In the years 2000, using PET, we were one of the first teams (Mazoyer et al., 2001) with the team of Marcus Raichle in St Louis in the United States to show that some regions of the brain present a default mode of operation without a specific cognitive task being necessary for their activation. This intrinsic activity is thus observed when a subject is in a resting state, letting his thoughts go. Subsequently, the development of fMRI, in particular by its ability to record signal dynamics, demonstrated that there is a so-called “resting” activity in the whole gray matter, in the form of very slow oscillatory variations of the BOLD signal of the order of one oscillation every 20 to 100 seconds. This phenomenon, described as spontaneous fluctuations, has the property of being synchronized on sets of more or less remote regions. These synchronous regions are thus considered functionally connected together and constitute a functional network linked to the intrinsic activity of the brain in the resting state. Thus, different functional networks are distinguished, each of which has a specific spontaneous activity. All these networks of intrinsic connectivity finally constitute a functional parcellation of the brain whose indentifying and studying its variability are the basis of our work (Doucet 2011, 2012, Naveau 2012).

Box 2. Samples of functional networks of intrinsic connectivity.
Functional parcellation of the brain from 29 networks of intrinsic connectivity extracted by the MICCA algorithm (Naveau et al. 2012). The analysis has been made from resting-state fMRI acquisitions of 282 subjects belonging to the BIL&GIN database. 1. Anterior and left lateral views of 5 networks mainly constituted of frontal regions; 2 to 5. Superior and left lateral views showing sensory-motor, fronto-temporo-parietal and default-mode networks, respectively; 6. Posterior and left lateral views showing intrinsic networks centered on auditory and visual areas.
These networks of intrinsic connectivity, the so-called resting-state networks, resemble strongly the networks supporting cognitive functions. In other words, the vast majority of functional networks identified in PET and fMRI using specific cognitive tasks such as the spatial orientation, language or action networks are similar to functional intrinsic networks observed at rest. It is therefore possible, on the basis of a simple acquisition of fMRI data of about ten minutes, to identify all of the functional networks of a subject when he does not perform any particular cognitive task, letting his thoughts freely go.
To what level of accuracy the intrinsic connectivity observed at rest can be predictive of the functional organization of human cognition?
The challenge is important because let imagine that it is possible to infer the integrity of cognitive functioning from a single resting-state fMRI acquisition, the consequences would go beyond neuroscience research to invest in medicine, by helping to diagnose neurology in case one or more networks show a different and/or degraded organization and even in cases where the network would no longer exist. The study presented in the box below is a step in this demonstration. It has enabled us to demonstrate that there exists at the level of intrinsic connectivity networks a trace of the atypical asymmetric organization of individuals whose hemispheric specialization for language is reversed in relation to the general population.
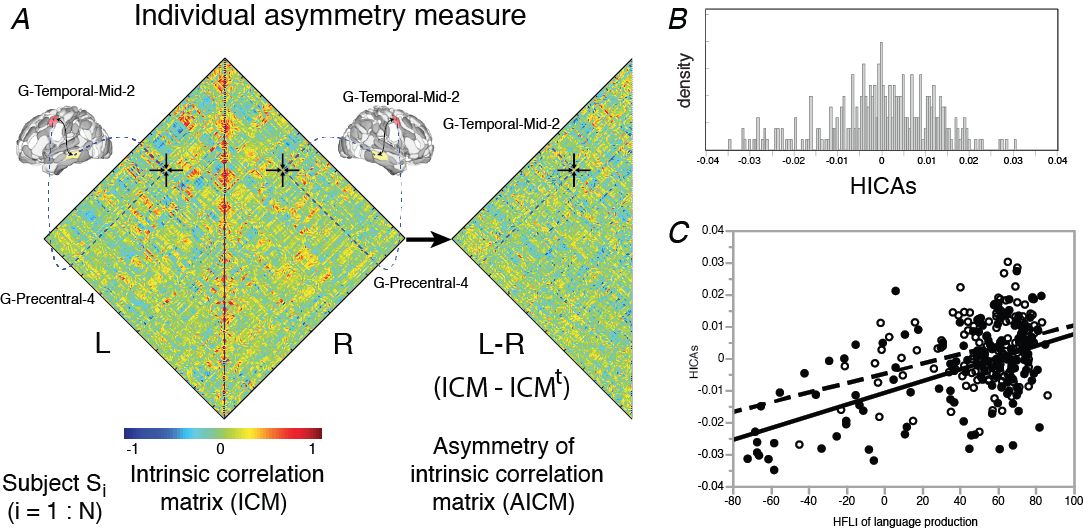
A. The intrinsic connectivity matrix of each region of the AICHA* atlas was computed within each hemisphere for each of 289 subjects from their resting-state fMRI (BIL&GIN, Mazoyer et al, 2016). An asymmetrical matrix of these intra-hemispheric correlations (AICM) was therefore derived by subtracting the left and right hemisphere matrices.
B. For each subject, an index of similarity of these asymmetrical hemispheric intrinsic connectivity (HICAS) by comparing its AICM to the 288 other AICMs. The graph shows here the distribution of these HICAS for the 289 subjects.
C. We observed a linear positive and significant relationship between the HICAS index and the index of hemispheric functional lateralization (HFLI) measured with a task of sentence production, with an effect of handedness. We have observed that the subjects with an atypical rightward asymmetry for language (HFLI < -50) show the strongest rightward asymmetry for intrinsic connectivity (HICAS < -0.02) (left-handers in black, right-handers in white).
* The AICHA atlas (Joliot et al., 2015) is an atlas of the human brain describing the homotopic areas of intrinsic connectivity. Each AICHA region of one hemisphere is paired with its homotopic counter-part in the other hemisphere by the fact that the spontaneous activity at resting-state between these two regions is more strongly correlated than for the rest of the brain.
Studying the human brain connectome requires both attention to anatomical connectivity and functional connectivity. From a general point of view, we know that the intrinsic activity of the brain and the various associated cognitive functions are necessarily constrained by the underlying anatomical connectivity, although the precise relationships between these two forms of connectivities are still far from being clear. Our aim is to bridge the gap between structure and function and to understand how the vast repertoire of functional states of the human brain can emerge from its anatomical structure.